2022 First Quarter Newsletter
Helping investors achieve optimal risk adjusted returns on their financial assets using low cost investment vehicles.
Market Trends
APRIL 30, 2022
SPY -12.9%, BND -9.6% SPY/GLD 2.3
TWI 60/30/10 ETF PORTFOLIO* -8.2%
PREDICTING INFLATION IS A FUZZY BUSINESS!
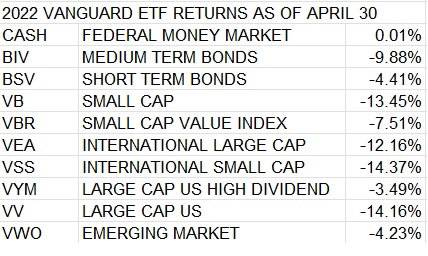
Metaphorically speaking the inflation horse is out of the barn, its tail is on fire, and its running around the farm setting everything else on fire. A March CPI (Consumer Price Index) report indicated a year over year inflation rate of 8.5%, something not seen in 40 years. Year to date the average bond fund was down over 10% and short-term bonds were down 5%. That’s the markets way of telling you - "future dollars are going to buy less." The only good news is that the yield new bond buyers will receive on just about any duration is up 1.0%. In this note I will take a stab at the fuzzy math-ee-ness of estimating where bonds may be headed in response to inflation and when and if the FED (U.S. Federal Reserve Bank) will get the inflation horse hosed down and back in the barn.
In an ideal world figuring out the inflation rate would be a straightforward math problem, requiring an estimate of just two numbers, the supply of money in circulation and the volume of money that changes hands in the economy during a given period of time. Unfortunately, for reasons I will explain, these numbers are a bit fuzzy. The supply of dollars can be estimated with a gauge called the M2 money supply, and the volume of money changing hands can be measured with a gauge called GDP (Gross Domestic Product). Paradoxically, inside the M2 number is a factor which is the amount that folks set aside for savings. We can guess, but never know exactly at any time how many dollars will be working in circulation and how many are just sitting idle. So, when helicopters full of PPP and extended unemployment money are dumped from the sky and folks just stash them in their garage, the active supply of money in circulation stays relatively fixed and no one notices inflation. However, when the relative number of goods to purchase are reduced, due to say tariffs and worker shortages because of C19, and everyone spends the excess money that dropped from the sky, prices start to rise. As a result, over the short term M2 and GDP can only provide an estimate of what is going on, making the math a bit fuzzy. Certainly, one would expect over long periods of time that the math works out well, and since anybody can get those numbers from the FRED (Federal Reserve Economic Database) website it shouldn’t be any trouble at estimating what inflation was or is likely to be. For example, during the ten-year period, between 2009-2019, the ratio of the M2 money supply to GDP grew at an average annual rate of 2.0%. However, the CPI, which is a statistical measure of inflation, only clocked in at average rate of 1.7% over that period. Because savings went up from a 5.6% rate in 2009 to a 7.3% rate in 2019, the relative supply of dollars in circulation was reduced by 0.3% annually.
Let's do some fuzzy math and see if we can figure out where inflation is headed. GDP over the course of 2020 was nearly flat, finishing the year at $21,478 billion then it grew to $24,002 billion by the end of 2021. Unfortunately, using M2 over the course of 2020 is complicated by the fact the FED decided to change the way it measures it, resulting in a fuzzy onetime $11.5 trillion adjustment to the M2 supply of money in May of 2020. Adjusting for that, I estimate the relative increase of the money supply for the two years 2020 and 2021 was a fuzzy $5.0 trillion verses a GDP increase of $2.5trillion. That leaves a fuzzy $2.5trillion surplus of dollars in circulation. Using an estimated GDP run rate of $25 trillion as the economy moves through the second quarter with a currency surplus of $2.5 trillion, simple division yields a fuzzy dilution ratio of 10%. Otherwise known as a 10% inflation rate. Keep in mind these numbers were changing rapidly through the end of 2021. M2 is provided monthly, while GDP quarterly, so that has to be a fuzzy estimate.
To be clear, the March 8.5% CPI is a backward-looking number. Recent surveys indicate that savings have declined, the money supply has continued to increase, and GNP has slowed going through April. The numbers can be volatile, but a year over year 10% CPI print on May 11th seems likely. That said, the Federal Reserve has stopped its bond purchases, and as interest rates rise saving will become more attractive. More importantly, if the economy continues to grow at a rate similar to the fourth quarter of 2021 it will absorb the excess dollars going into year end. Higher rates should act to slow U.S. Treasury spending, as more of the budget gets eaten up servicing debt. With elections looming U.S. House and Senate may get a more fiscally responsible profile. I expect the inflation to top off and come back down in the second half. Perhaps as soon as the June.
My base case assumes that U.S. governments spending growth and Federal Reserve monetary policy go back to pre-C19 settings some time in the second quarter. Also, that rising interest rates encourage more savings, helping to tamp down inflation. Longer term U.S. Treasury bond investors wishing to recover their lost purchasing power will look for a further 1% increase in yields to recapture loses over the next 7+/- years. This suggests the market will be looking for a 3% average intermediate Treasury rate this year. I expect the yield on the 7-year U.S. Treasury to reach or slightly exceed 3% this summer, and then to decline back to 2.5% by year end, and the ten-year U.S. Treasury to perhaps scrape 3.25% during that time falling back to 3%. If true, that brings me to the conclusion that medium-term bonds have about 3-5% more to fall with short term bonds falling 1-3% more by the end of June before stabilizing.
If my fuzzy math is correct, and U.S. government spending falls back in line with normalized economic growth, bond investors can start to feel safe buying again sometime later this summer. For now, hold cash and be patient. Look for average short term bond rates, like those offered by the BSV (Vanguard short term bond ETF) to rise above 3.0%, dipping below $76.00 a share before it is probably safe to buy again. Similarly, I have an entry point below $76.35 a share for the BIV (Vanguard intermediate term bond ETF) but that could go a bit lower. Be aware, there will be bumps along the way caused by market illiquidity, and policy missteps. Hopefully Janet Yellen proves to be as good a Treasury Secretary as she was FED Chairman because Chairman Jerome Powel has demonstrated a far too dovish monetary posture. The stock market will likely end the year flat from where it started. Be warned, if medium term U.S. Treasury rates go much higher than 3.75% this summer August will be a volatile month for stocks, and if over 4.0%, the market will likely continue its sell off. The stock market could also get jittery if Russia’s war in the Ukraine broches its boarders. Predicting the future has always been a bit of a fuzzy business. Enjoy your spring!
*The percentages reported are year to date as of market close - April 29, 2022. The TWI 60/30/10 ETF PORTFOLIO is my custom 60 % stock / 30% bond / and 10% cash blend primarily of Vanguard indexed based ETF's. The SPY is the S&P 500 trust ETF. The BND is Vanguards Total Bonds Market ETF.
Invest Wisely!
Douglas A. McClennen(508) 237-2316